Swan River habitat mapping
Areas of the Swan River in Western Australia have been mapped by CMST using Sidescan sonar to classify seabed habitats and in particular to determine the distribution of seagrass. Seagrass distribution and other measures of seagrass condition have been used as broad scale biological indicators of marine and estuarine health.
Until recently the distribution of seagrass in the Swan-Canning Estuary has relied on aerial photographs with little or no ground-truthing to verify the images. Aerial images are prone to several errors and ground-truthing by divers is labour intensive and also prone to error. Sidescan sonar (SSS) provides a viable alternative to aerial surveys and divers.
The main objective of this work was to determine the spatial presence of seagrass in selected regions of the Swan River by conducting SSS survey.
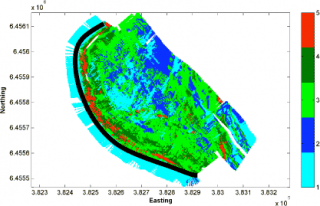
SSS was successfully used to collect 4.4 km2 of backscatter data from 10 survey areas in the Swan River. A simple threshold classification method was used to produce geo-referenced habitat maps showing the predicted distribution of low and high density seagrass, sand, mud and rock. Although SSS was successful at identifying seagrass, determining the relative density of seagrass from SSS data is still an area requiring further research.
SSS is considered effective and efficient for similar studies in other shallow water estuaries provided it is conducted in conjunction with ground-truthing. It can complement direct observations and save time in the field by covering a large.